[List of posts | playground | source code for this post]
In the last post we introduced the concept of a distribution as a way of abstracting randomness. Today we'll see how powerful this abstraction is, as it allows us to compose distributions without sacrificing functional purity.
Repeating distributions
Last time we had this function which repeatedly sampled from a given distribution.
private static IEnumerable<T> TakeSamples<T, TRng>(
    IDistribution<T> dist, int count, TRng rng)
    where TRng : notnull, IRng
{
    for (int i = 0; i < count; i++)
    {
        yield return dist.Sample(rng);
    }
}
As we go through this series, we'll aim to put as much code as possible into the functional core. Looking at the code snippet above, one thing that jumps out at me is that the idea of repeatedly sampling from a distribution can be classed as a distribution in and of itself.
So I've extracted an extension method which transforms a single-valued distribution into a distribution returning multiple values.
public static class DistributionExtensions
{
    public static IDistribution<IEnumerable<T>> Repeat<T>(
        this IDistribution<T> dist, int count) =>
        new RepeatDistribution<T>(dist, count);

    private class RepeatDistribution<T>(IDistribution<T> dist, int count) :
        IDistribution<IEnumerable<T>>
    {
        public IEnumerable<T> Sample<TRng>(TRng rng) where TRng : notnull, IRng
        {
            for (int i = 0; i < count; i++)
            {
                yield return dist.Sample(rng);
            }
        }
    }
}
This moves more code into the functional core, and allows us to simplify the call site:
private void DisplayHistogram()
{
    var rng = StandardRng.Create();
    var dist = Uniform.New(0d, 1d).Repeat(count: 100_000);

    var values = dist.Sample(rng);

    DisplayHistogram(values);
}
What we've done here is to change the abstraction: instead of having a distribution and iteratively taking values from it, we now have a distribution which generates a collection of values in one call. This idea of composing distributions to make new ones will be important for us, and is very much in keeping with the ethos of FP.
Transforming distributions
In order to display the histogram what we ultimately want is not a collection of
values, but a Histogram object itself. So let's push the idea of composing
distributions one step further, and use the Select() method from RandN to
transform the distribution of value-collections into a distribution of
histograms.
var dist =
    Uniform.New(0d, 1d)
        .Repeat(count: 100_000)
        .Select(v => Histogram.New(v, min: 0, max: 1));
This method is called Select() intentionally to match up with Select() from
LINQ. It does the same thing to a distribution as the equivalent LINQ method
does to enumerables; that is, it transforms the type of the distribution using a
function which can be applied to the underlying type.
Although I've chosen not to here, the signature of this method means we could use C#'s query syntax instead:
var dist =
  from v in Uniform.New(0d, 1d).Repeat(count: 100_000)
  select Histogram.New(v, min: 0, max: 1);
Flattening distributions
Let's turn things up a notch. We can use the Box-Muller algorithm to generate a normal distribution (also known as a Gaussian) from two uniformly-distributed values. The obvious way to write this is with a new class.
public static class Normal
{
    public static IDistribution<double> New() => new NormalDistribution();

    private class NormalDistribution : IDistribution<double>
    {
        public double Sample<TRng>(TRng rng) where TRng : notnull, IRng
        {
            var uniformDist = Uniform.New(0d, 1d);

            var u1 = uniformDist.Sample(rng);
            var u2 = uniformDist.Sample(rng);

            return
                Math.Sqrt(-2.0 * Math.Log(u1))
                * Math.Cos(2.0 * Math.PI * u2);
        }
    }
}
However, we can make things simpler by using the SelectMany() method. This is
again similar to SelectMany() in LINQ, allowing you to sample from multiple
distributions and flatten the results. This time I think the code is definitely
better off using query syntax than method syntax.
public static class Normal
{
    public static IDistribution<double> New() =>
        from u1 in Uniform.New(0d, 1d)
        from u2 in Uniform.New(0d, 1d)
        select
            Math.Sqrt(-2.0 * Math.Log(u1))
            * Math.Cos(2.0 * Math.PI * u2);
}
We can again plot this as a histogram:
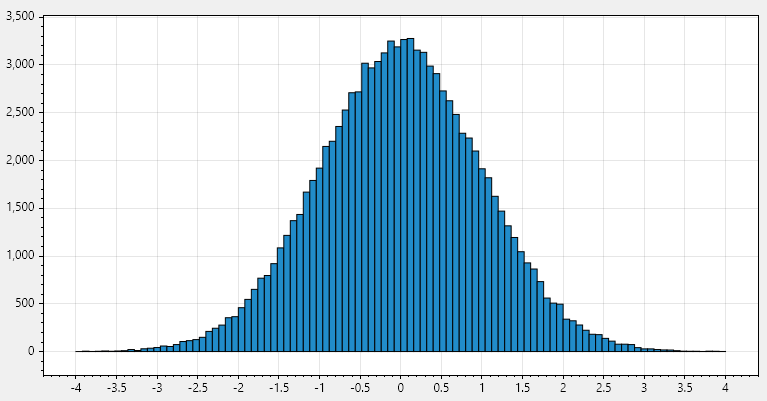
A very satisfying bell curve!
Conclusion
We've made a lot of progress so far; these methods for composing and transforming distributions will be very useful as we go through this series.
However, we can't really say we've done any procedural generation yet. In the next post we'll start using stochastic algorithms to generate mazes.